
Design System Foundations
Joining wtec as a design technologist, my role involved implementing new and legacy functionality within a single page Angular app (smartmanager), the counterpart to wtec's smartengine hardware powering LED lighting and sensors for commercial buildings. Leveraging a bespoke design system built with Angular Material, core functionality was expanded in three key areas: analytics, device commissioning, and floor plan mapping. Designing at scale involved (i) expanding the design system to include expansion panels, modal wizards, chart elements, and other enhanced components, and (ii) mocking up specific states with data using Storybook to test assumptions and iterate designs.
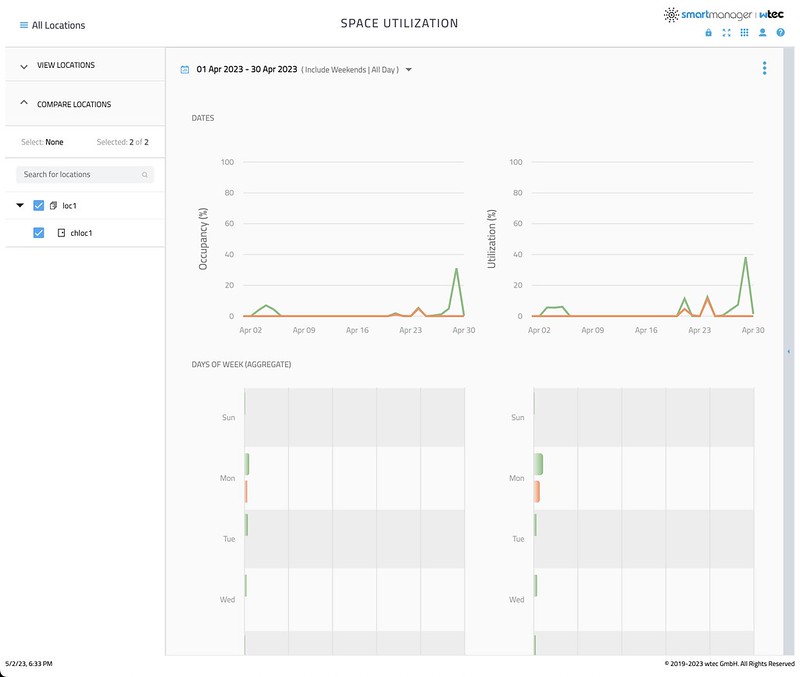
Analytics
Built with Angular and NgxCharts, Space Utilization leverages multiple design system components to assemble and visualize data across locations. The line graphs, histograms, and heat maps allow the user to quickly explore filtered collections and identify outliers not readily apparent in a single view or data table. Space Utilization views can also be configured to compare data across separate locations (up to three) and for export as a PDF report.


Design for the Internet of Things
Assembling and filtering large collections of devices is essential for an application managing thousands of endpoints across multiple locations. The card collection component allows the user to view multiple endpoint details that aid identification and review. Likewise, the multi-step wizard avoids clutter to ensure user focus stays on task, enabling the user to commit bulk actions efficiently. Finally, the event/policy grid provides a timeline-based visual to highlight active policy settings.


Floor Plan Editor and Viewer
The Floor Plan Editor enables users to upload plans and map locations and associated fixtures with drag-and-drop interactivity. Built with Canvas/Fabric and implemented in smartmanager, the editor enables users to pin fixtures (lights, sensors) to specific locations. Once linked to commissioned devices in the editor, the viewer can display sensor data (including occupancy, power usage, temperature, and device status) as colors mapped to the location shapes. Popovers and tooltips enhance usability by providing context to aid discovery.


